SmartPool Data and Analysis
Momin Ahmad
2021/07/21
On July 19th, 2021, we launched our SmartPool application as a limited release BETA on our Discord server (https://discord.gg/R6qmrjTEh8).
Purpose
As we discussed in our last blog post, Uniswap V3 presents quite a few new features that were intended to increase returns, but also expose the user to more risk. I encourage you to check out this blog post from
Neil Zumwalde before going through our data analysis on this post.
The Risk and Rewards of Uniswap
With our end game being a fully decentralized risk-modeling platform, we decided to start that journey by demonstrating how our models can provide insight on a popular DeFi application like Uniswap. The shift from V2 to V3 illustrates exactly how the DeFi landscape is constantly evolving and why dynamic, community validated risk models are imperative to the retail user.
Given that, we had several goals for this application:
- Offering data and insights on the pools themselves. For example, illustrating how the correlation between the price of 2 assets in a pool can increase or decrease the risk of Impermanent Loss
- Users maintain custody of their assets throughout the process and use the data from our models to make their own decisions. Our goal is NOT to take custody of assets, but instead to provide retail users the tools they need to participate in DeFi.
- Demonstrate how our risk models can power applications.
Data and Analysis
Credit to JNP for his fantastic work building a backtesting tool for Uniswap V3. You can check out his previous work here:
A ‘real-world’ framework for backtesting Uniswap V3 strategies
First, let’s take a macro look at how our models performed. Later, we’ll take a look at some specific pools that we found particularly interesting.
Using his backtesting tool, we simulated each of the USDC/ETH and ETH/WBTC Credmark Fixed Bollinger Band models on 3 different 2 week periods: June 1–15, June 15–30 and July 1–15. All numbers are based on investing $1000 for each 2 week period.
Some notes about each of these time periods:
- June 1 — June 15 — ETH price started and ended around $2500 — BTC/ETH saw rare divergence as BTC rose 10%
- June 15 — July 1 —Both ETH (-15%) and BTC (-17%) saw their prices fall during this period.
- July 1 — July 15 — Once again, both variable assets saw their prices fall, ETH by -9% and BTC by -6%.
Now about those results…
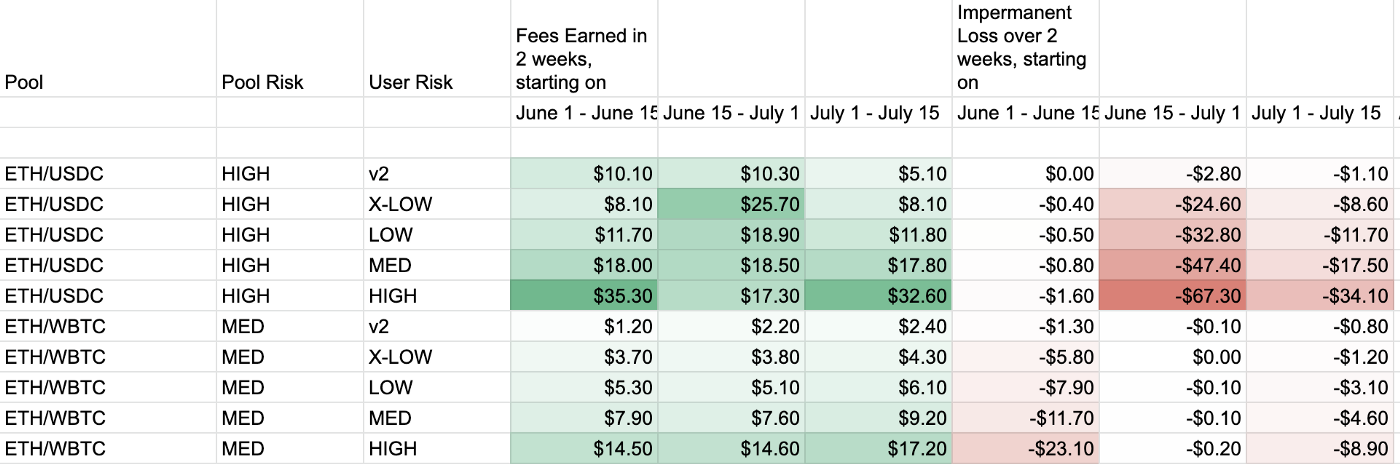
Results for 2 week periods. Each period assumes $1000 was invested in each strategy
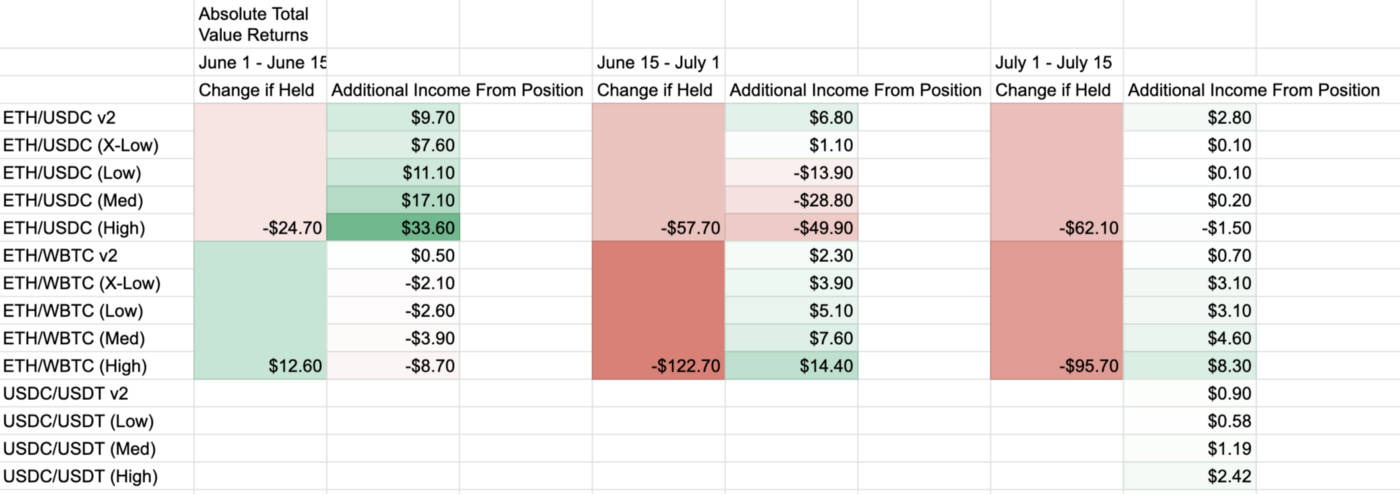
This chart compares the total Profit-and-Loss of each strategy against holding 50/50 of each asset
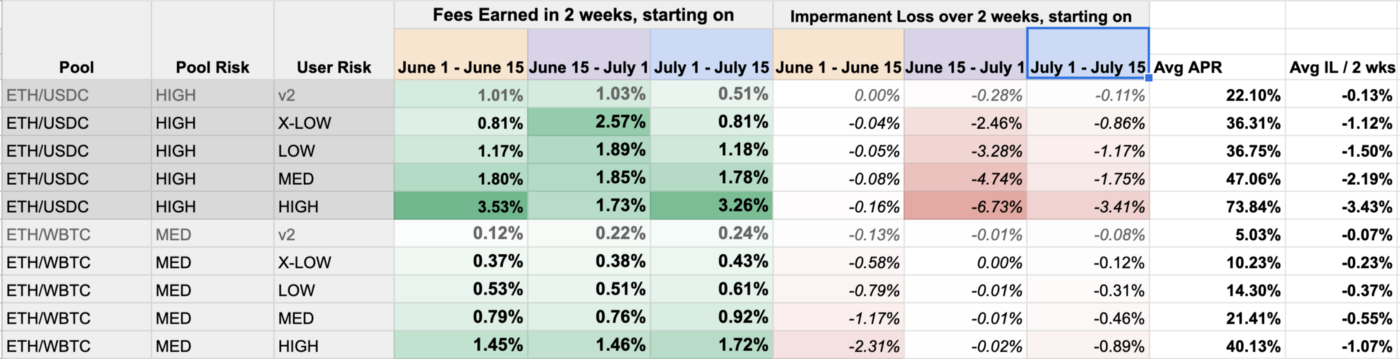
This chart shows both fees and IL as a percentage.
This first chart compares 4 of our strategies against simply providing liquidity to the same pool on V2. A few things in particular stand out:
- 2 out of the 3 weeks saw BTC/ETH move in tandem, greatly reducing the Impermanent Loss suffered. However the, the one time period that saw divergence saw losses in all 5 strategies. But, given historical trends, a high risk BTC/ETH position looks to be a solid investment for retail consumers
- Uniswap V2 protects the user from Impermanent Loss more than any of our V3 strategies for ETH-USDC. We saw only 1 out of 3 time periods generate positive returns as the volatility of ETH proved to be far too high to generate enough fees to offset impermanent loss.
- We also measured a USDT-USDC pool over the entire 45 day period and found that impermanent loss was negligible. Stablecoin pairs represent an excellent source of low risk, consistent yield. While lending stablecoins (Compound, Aave, Cream etc) can be a more profitable endeavor, we believe swap pools represent lower risk to the user. See our blogpost on Aave’s over-utilized USDC pool for some color on this.
GOING RIGHT UP TO THE EDGE OF A DEFI LIQUIDITY CRISIS
Now lets take a look at some specific pools.
WBTC-ETH High Risk Strategy over each time period.
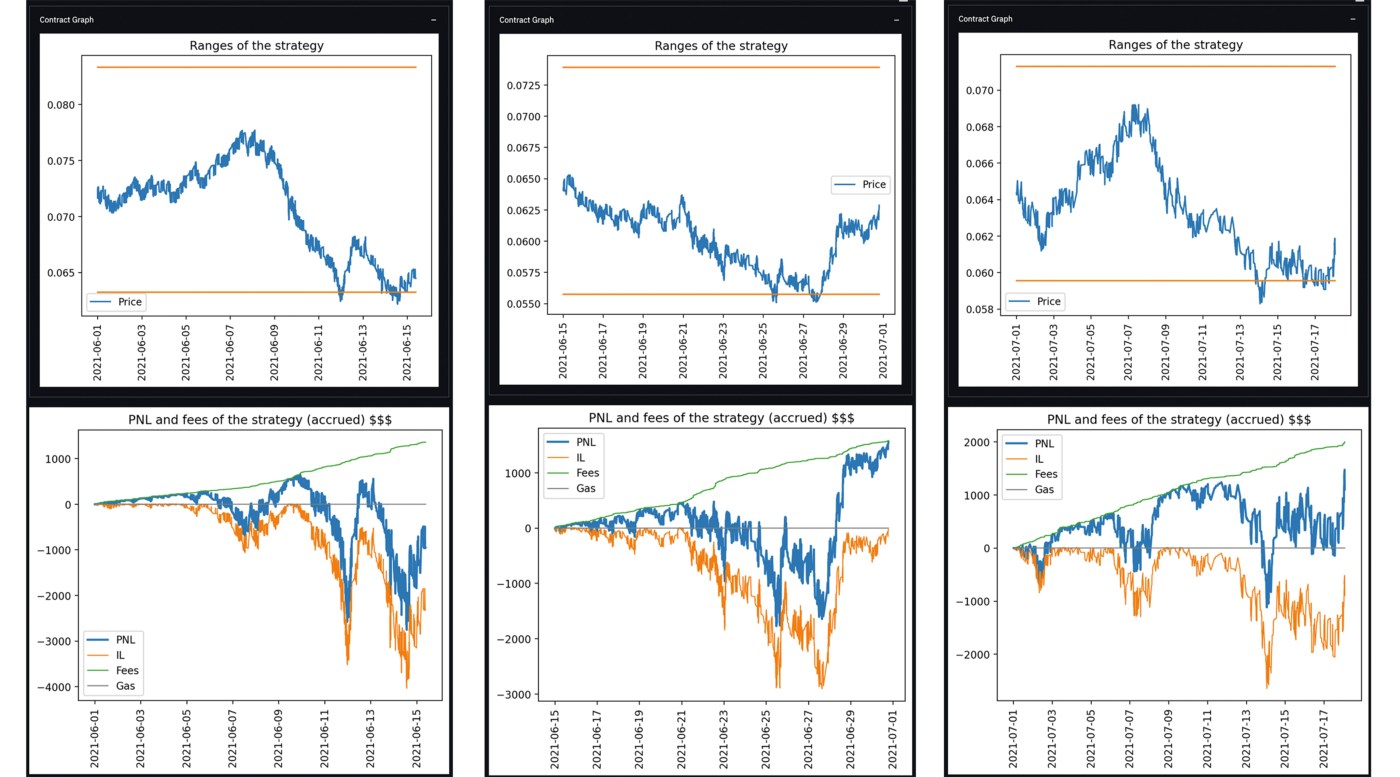
As discussed earlier, this pool was profitable for 2 out of 3 test periods.
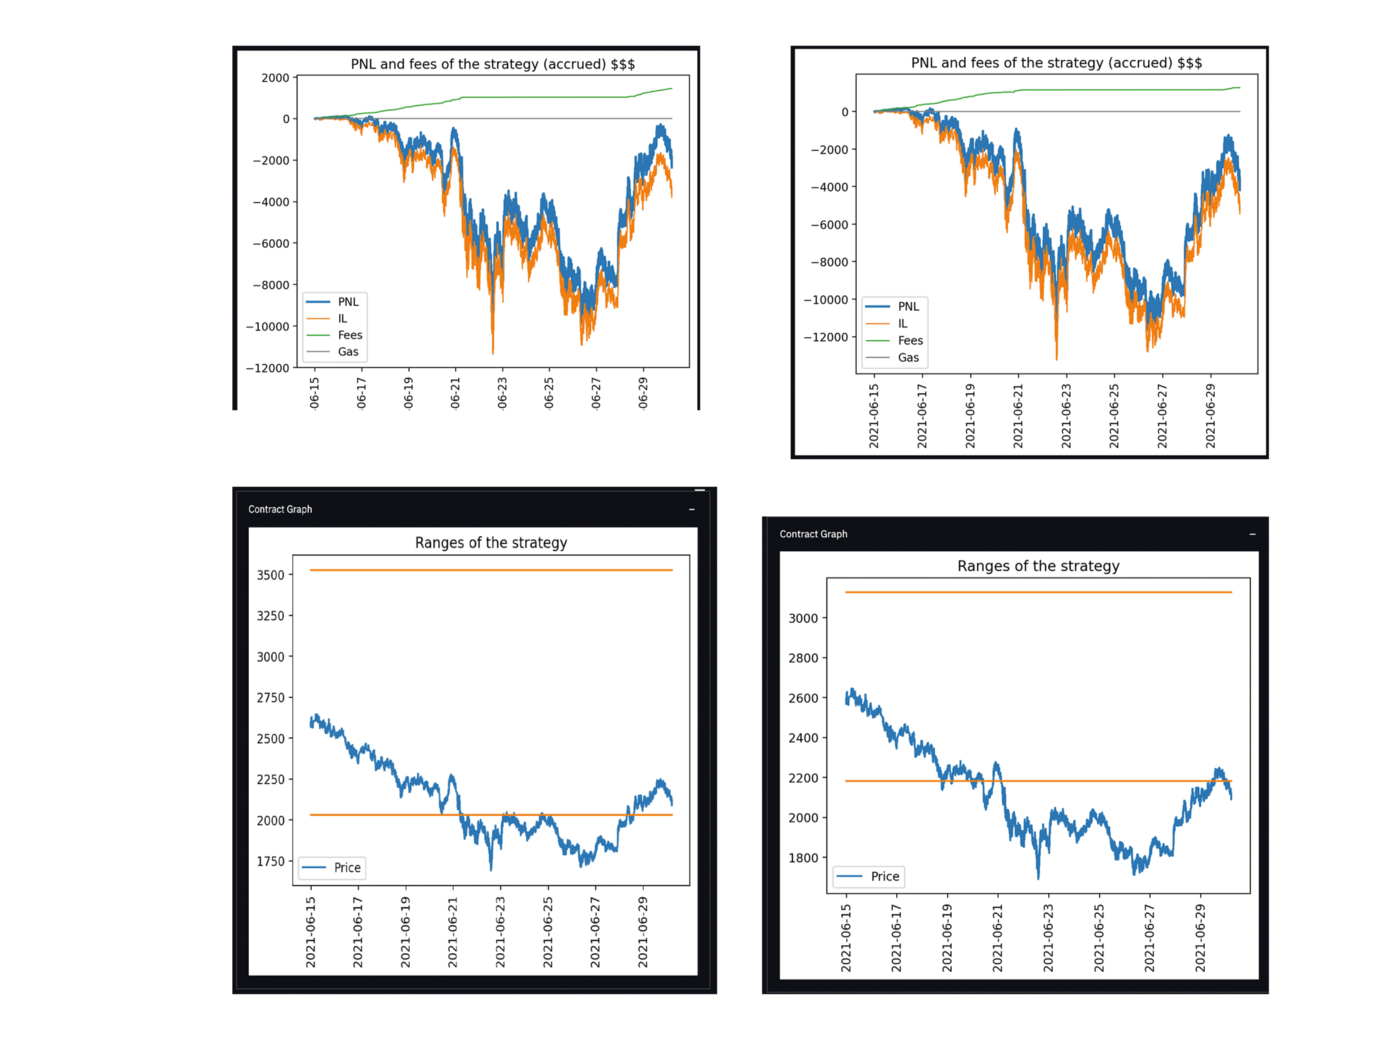
June 15th — June 30 ETH-USDC Low and Medium Risk
Conclusions
ETH-USDC is a volatile pool for retail investment. Given the price fluctuations and volume trending away from the 0.3% pool and into the 0.05% pool, the numbers show that Impermanent Loss eats away at any fees that may have been generated. LP’ing into V2 generated better returns than static V3 strategies.
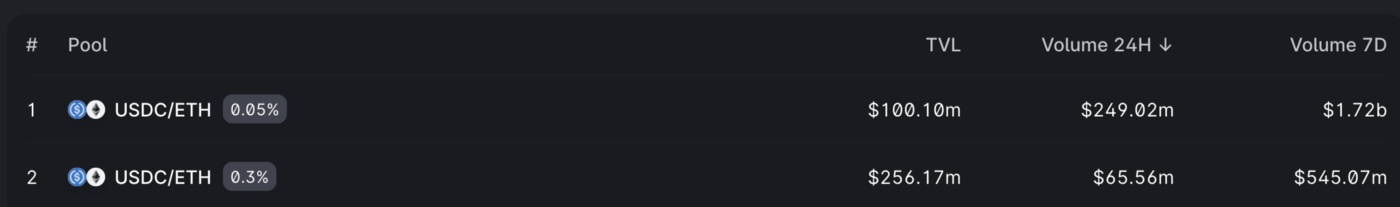
Snapshot of TVL and Volume on July 21, 2021
The charts below show stagnation and even a slight decrease in TVL for the 0.3% pool while we see consistent increases for the 0.05% pool.

However, there are periods of time where V3 can be profitable. For example, 6/1–6/15 yielded great returns on a USDC-ETH position.
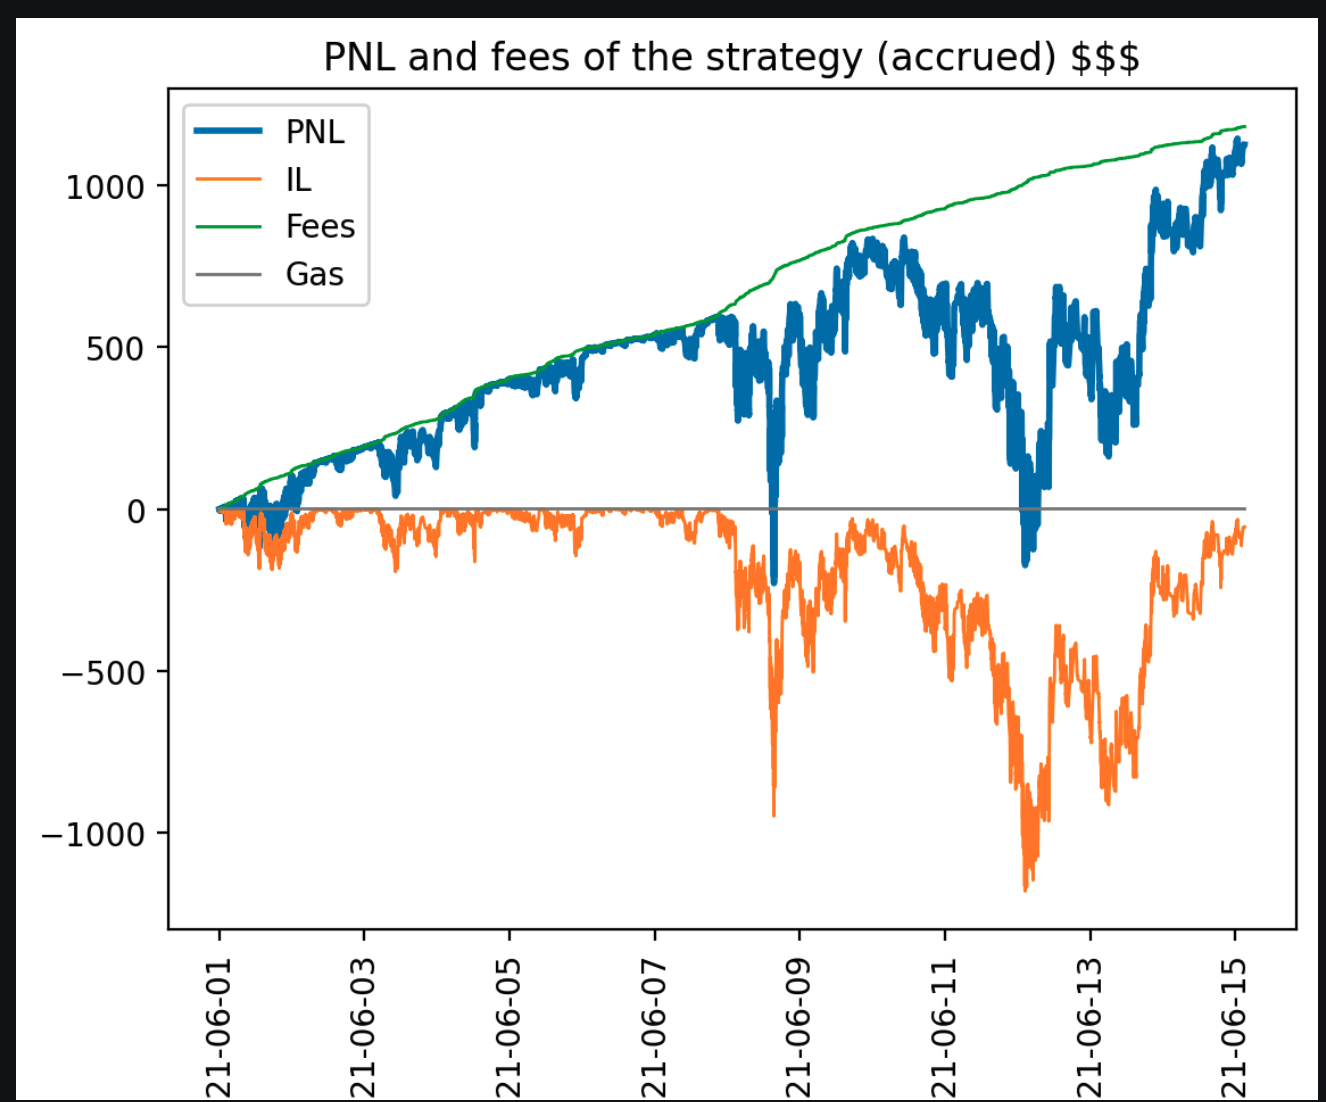
This suggests that LP’ing into ETH-USDC on V3 requires an active strategy that takes takes additional risks on predicting price movement, or that this pool only makes sense to LP for short, strategic periods of time.
Conversely, WBTC-ETH has proven to be a great place for passive LP’ing. Historically, both assets are correlated by about 85% meaning that the risk of IL is much lower. This pool allows the LP’er to realize any upside price movement, while also enjoying high APR’s off of fees.
One possible conclusion based on these results is whether or not LP’ing is a viable strategy for retail in the long run. There are potentially better places to seek yield on both BTC and ETH and for other, more volatile pools, either massive amounts of capital or highly active liquidity management strategies are necessary for LP’ing to make sense. Trends in traditional finance indicate that eventually fees for trading trend toward 0, and that the current LP’ing yield is a result of inefficiencies in the market.
V3 does provide enough granular control there are endless possibilities for devs and financial strategists to come up with innovative ways to generate yield and provide data on these platforms. It is possible that given enough time and data, strategies can be developed that give retail users enough of an edge that LP’ing remains a viable option for yield.
We’ll be exploring some alternative strategies to Bollinger bands next week and dig into how other strategies might be better suited for certain pools.
Check out all our data from backtesting here:
https://docs.google.com/spreadsheets/d/1_b7KMFvV6GjQPQmQQ3iutjM0JLz_DVdcz4XrgV0ESmw/edit?usp=sharing

Sign up for our newsletter for the latest product updates, partnerships, and more.